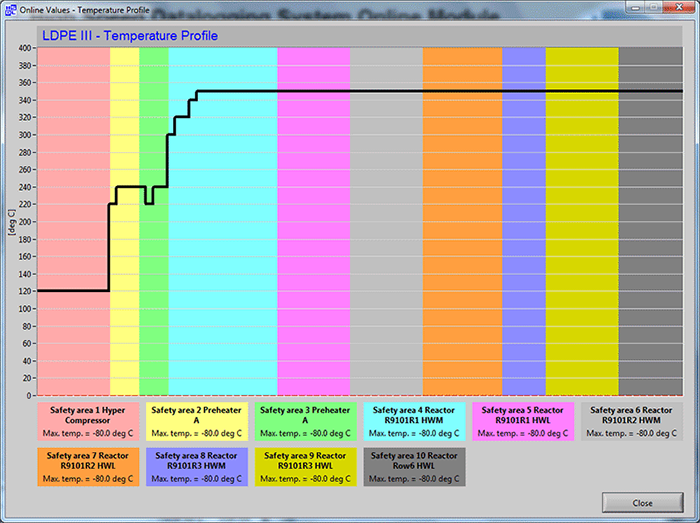
Apart from the traditional table display of the instantaneous values or their very recent history in rolling-chart graph, the HSDL has a capability of organizing data into a bar graph where each bar represents one input channel and the height of the bar represents the signal value. The channels within such graph should have the same unit and order of magnitude in order to display meaningful information to the user.
The values (bar heights) are updated instantaneously providing a real-time, easy-to-compare view of signal amplitude on multiple channels at a time.
The typical use would be to show temperature profile along various stages of the monitored process, thus the name Multi-Channel Profile View.

HSDL Temperature Profile
The Multi-Channel Profile View is user configurable and in standard version can show up-to 20 channels at a time.
